Framework for scaling analytics – Data 2030 summit


Getting familiar with the basics of data analytics can be a daunting task. With so many buzz words flying around and different technologies involved often folks get confused and takes time get the basics right.
This workshop was designed to demystify starting with data analytics & data quality for:
Before we talk about data quality, it was important to give an into to big data, data pipelines and all the stages across the pipeline.
Across the 2 hour sessions on two days, we first discussed the:
The first day was mostly to get the basics & internalize the activities at each stage without going more technical into the code
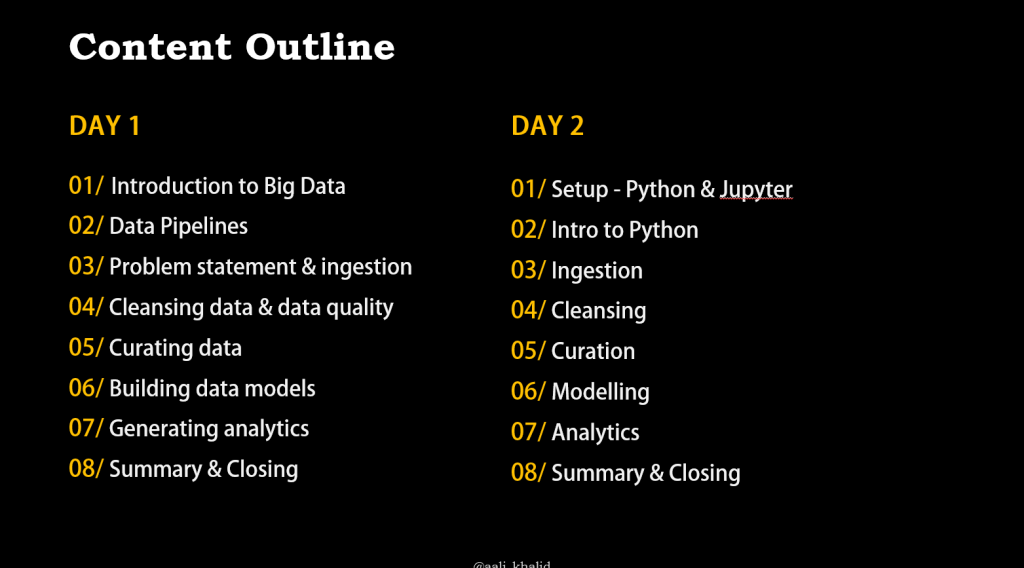
Once folks had an idea of what needs to happen at each stage, on the second day participants went about practically implementing all stages in the pipeline.
This was tricky when I was planning the workshop. With most workshops, after some basic theory participants jump onto coding. I’ve always found that to be a rough transition which makes it hard for participants to follow along with, especially if they are working not writing code on a daily basis.
Therefore, the first day was to understand the concepts, the secret was not just death by PowerPoint – but participants actually performing the steps across the pipeline / but not with code. To make life easy, we did that with excel – no tooling knowledge required – pure focus on understanding the WHY of each activity!
The second day was all about coding with baby steps. We started from:
The code was quite a bit to go over, but was designed in such a way that participants can easily follow along afterwards by providing ample documentation within the code.
The content we covered was A LOT, I think could have easily been done in 6 hours instead of 4. It was a toss between dropping content and trying to cover more in less time.
That’s where my personality kicks in – I have a hard time cutting down on content – because I feel I need to share what I know, I’ve experienced the struggle of learning this – and hope people who learn from me don’t have to struggle as much.
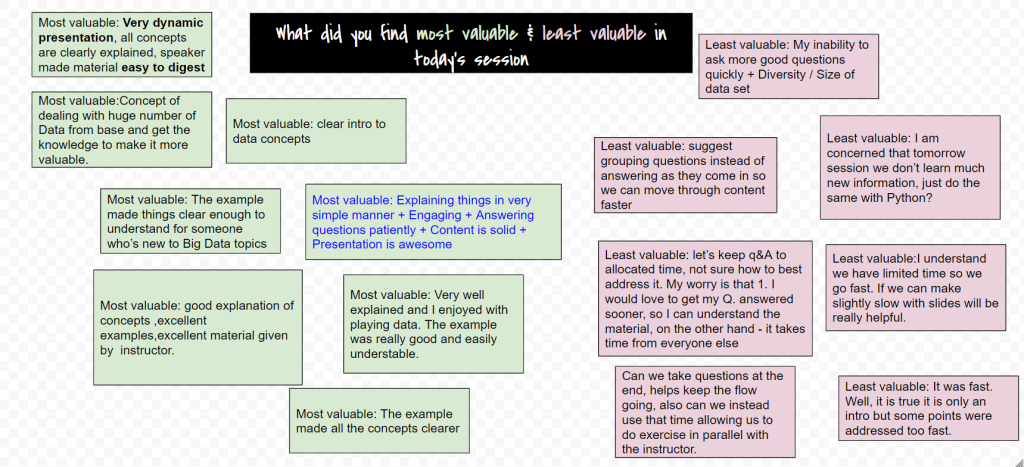
“Explaining things in a very simple manner, Engaging answering questions patiently – Content is Solid and awesome presentation”
Participant feedback
Organizations when start on their data analytics journey, it mostly begins as an MVP (Minimum Viable Product) and evolved over time. While that is exactly how things should go – sometimes they miss out on building the foundations right as they evolve their MVP. A big factor that get’s missed is around data quality, data governance & stewardship.
From my experience building a data pipeline it not the challenging part – ensuring data saved in our warehouse is of quality (fit for purpose) is the tricky part. Unfortunately this is easier said than done and requires some foundational work and structure to consistently deliver quality data.
In this talk at TestBash New Zealand 2020 I gave a quick introduction to how data analytics works and discussed some basics of building quality into your data pipeline.
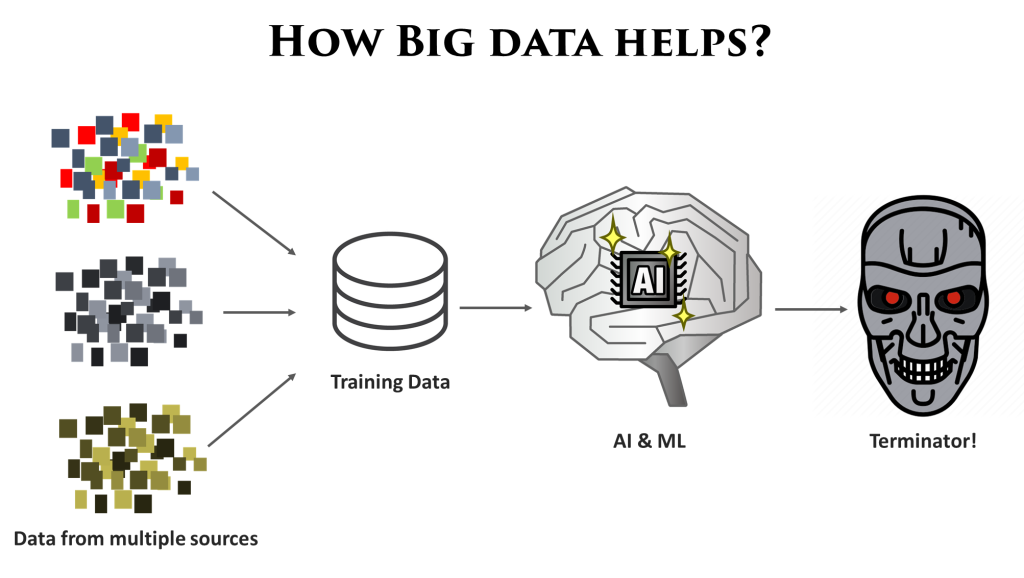
It’s surprising how easy it is for teams to forget the importance of having ‘fit for purpose’ data – be that for business intelligence, analytics and especially AI / ML initiatives. This is precisely what I like to remind teams I work with is – it all starts with having the right data.
For building enterprise data assets, often we get data from a lot of different sources across the organization & perhaps from 3rd part sources also. These sources have their own paradigms in which the data is developed and consumed, and may not always be consistent with one another.
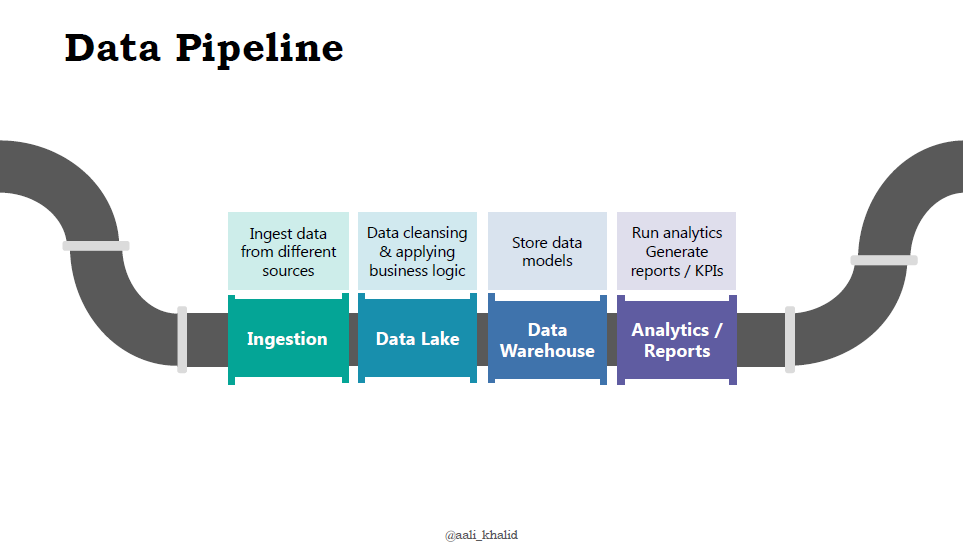
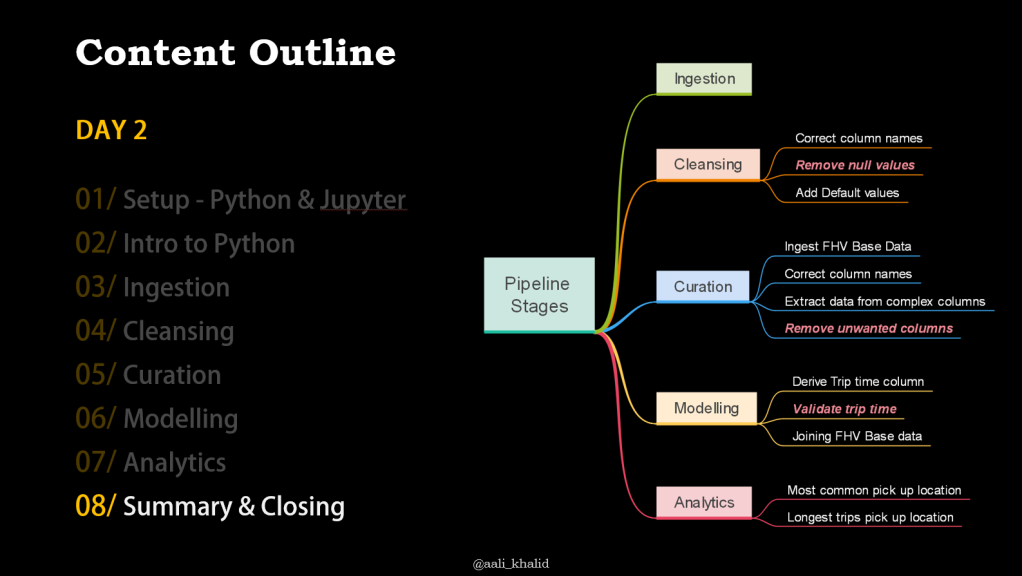
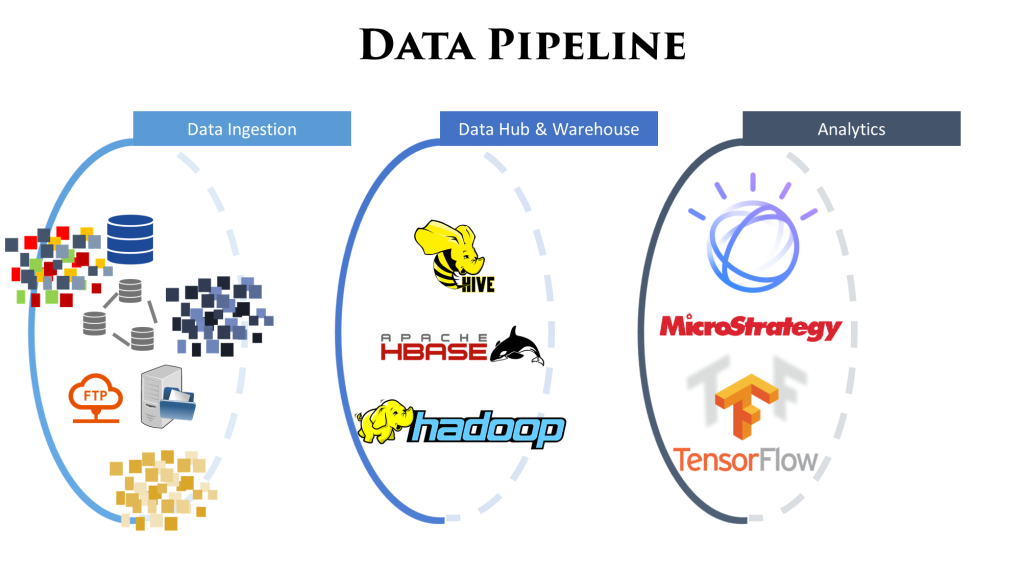
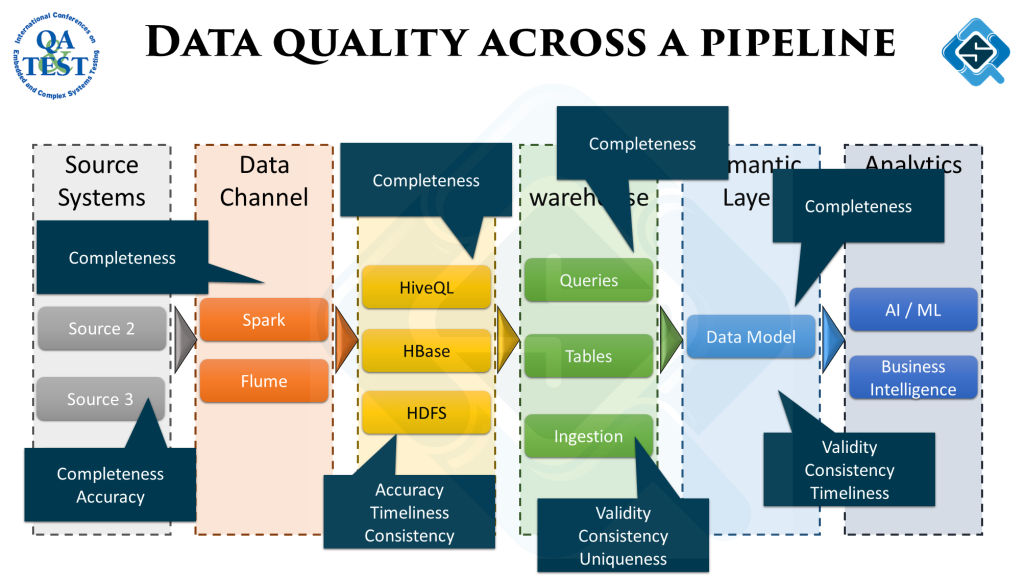
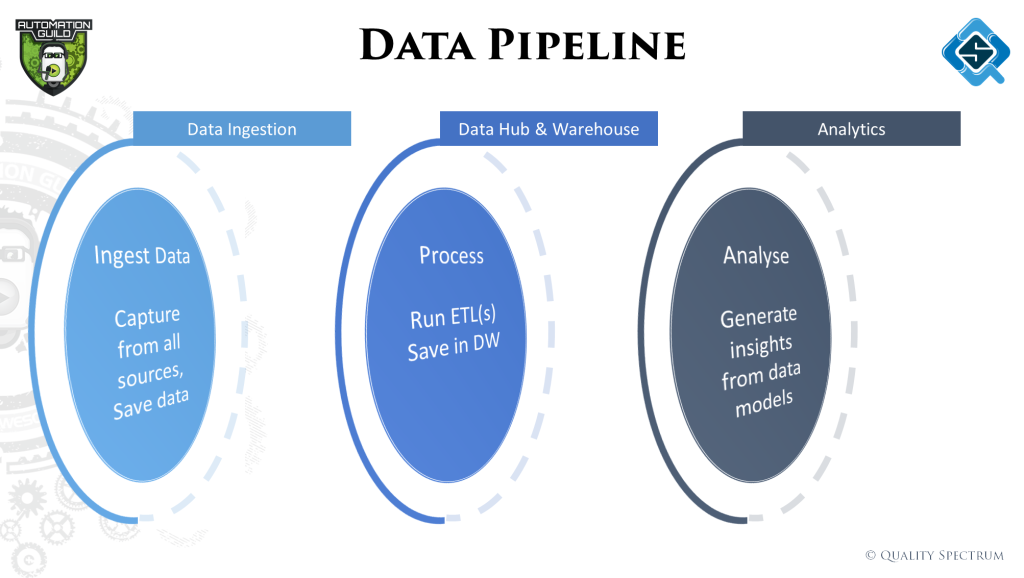
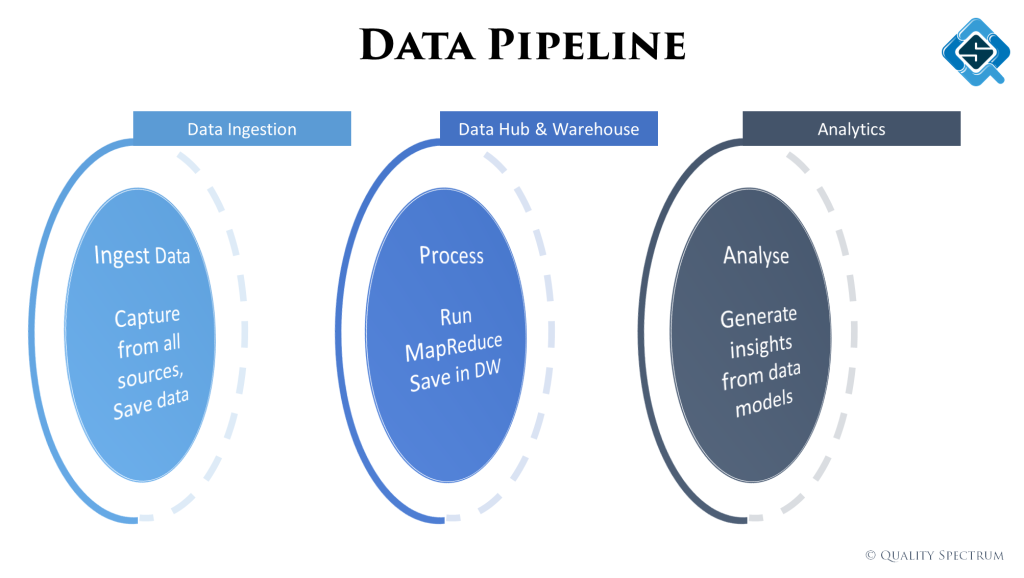
To homogenize all this data and make it fit for purpose, it passes through a lot of different stages of cleansing, curating, transforming and modelling. All these activities combined are called the data pipeline.
Image below gives a high level overview of a sample data pipeline:
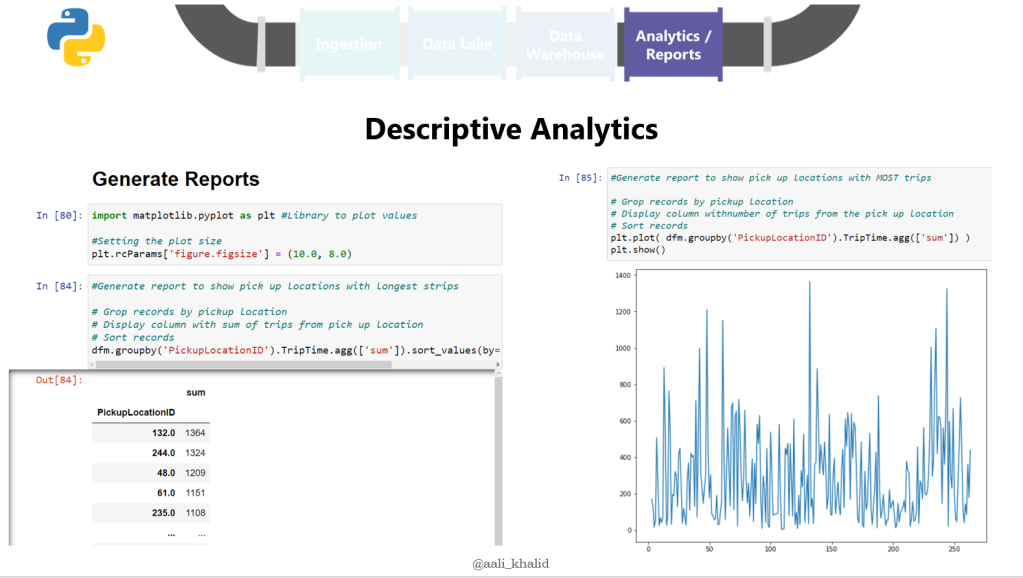
To get the desired output from analytics, the quality of data across the data pipeline has to be measured and fixed. It happens at the analytics stage we get data which might not add up. Backtracking from there to figure out exactly what went wrong is a tedious job.
To avoid this, data quality must be measured across all stages. Here is a sample process to writing these quality checks:
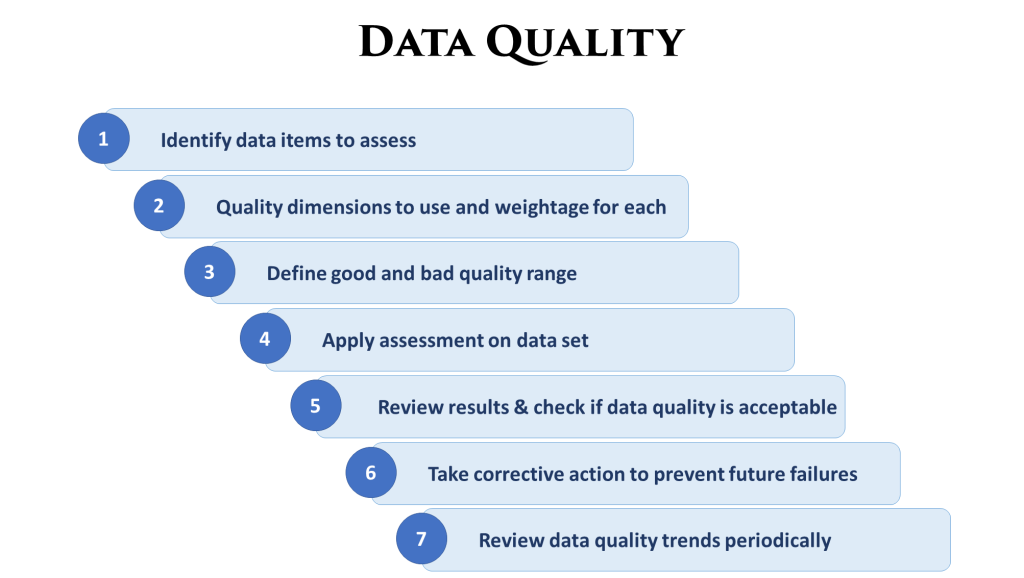
At different stages, different type of data quality checks might be more important. While ingesting data we would be more concerned if the source data is as per the defined schema. As we move along the pipeline the objectives of the checks change according to the underlying ETL process.

Getting quality of the data right is always a journey and never ends. Being agile about this and consistently working on feedback gathered from these quality checks is paramount for success in any data analytics initiative.
This year’s QA&TEST conference 2020 was another great addition. While planning the event there were discussions on if the event is supposed to be in person or online, turns out doing it online was definitely the right choice. I did miss the traditional Bilbao food from last year and an amazing experience when I was there as a speaker, the online event this year was also well done too.
The AI track of the event had a talk by Parveen Kumar and a panel discussion with a quick 10-minute talk by all panelists followed by discussions on testing AI systems. Had a blast with the panelists, we all were from different backgrounds but surprisingly had very similar thoughts and challenges on talking about testing AI products. Thoroughly enjoyed the talks and presentations and gave me some new insights too which I want to share in this article.
Folks when thinking about testing AI systems start debating how to get into that black box neural network to figure out what’s going on and how to test it? The challenge off course, these are evolving programs which no one directly controls. In case of machine learning algorithms, the biggest factor is the data used to train the model – and IMHO that’s where testing should start from.
Before loads of data can be fed into the models, all that data needs to be gathered, cleansed and modelled. In my segment I talked about some fundamental concepts like data pipelines, data quality across these pipelines and some quality checks to look out for across different stages.
All this usually starts with ‘Big’ data, which means the variety of data, speed of processing and size of data plays a big factor. From gathering this data till feeding it to an AI model, data passes through lots of stages. On a high level we classify them as:
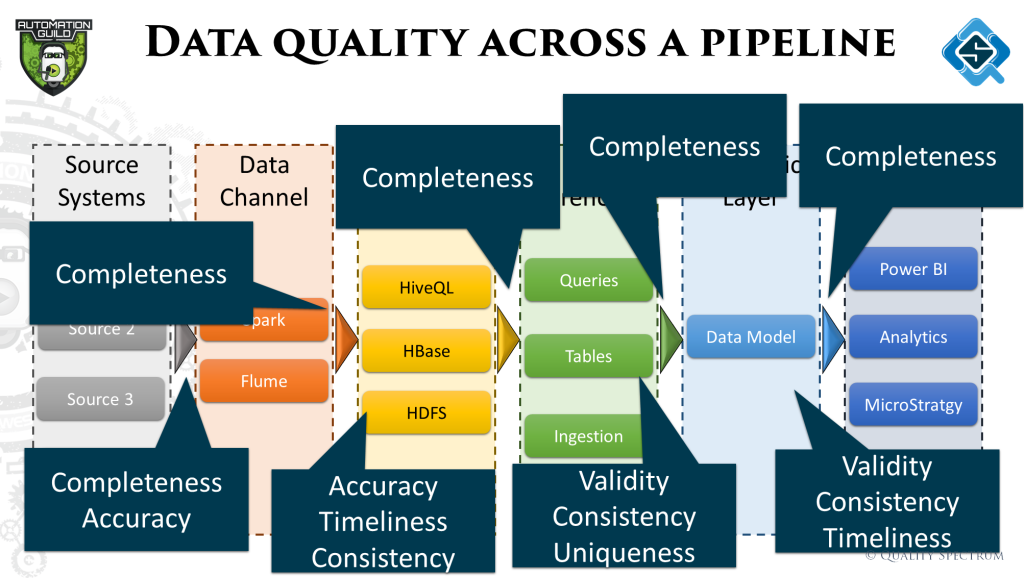
As data is processed through this pipeline, the quality of data has to be measured to ensure as an end output we are able to provide clean data. One of the techniques to do this is data quality dimensions. There are 6 different attributes / characteristics (dimensions) which any data set should conform to. Measuring your data for these dimensions helps to analyze if the data is accurate and fir for purpose.
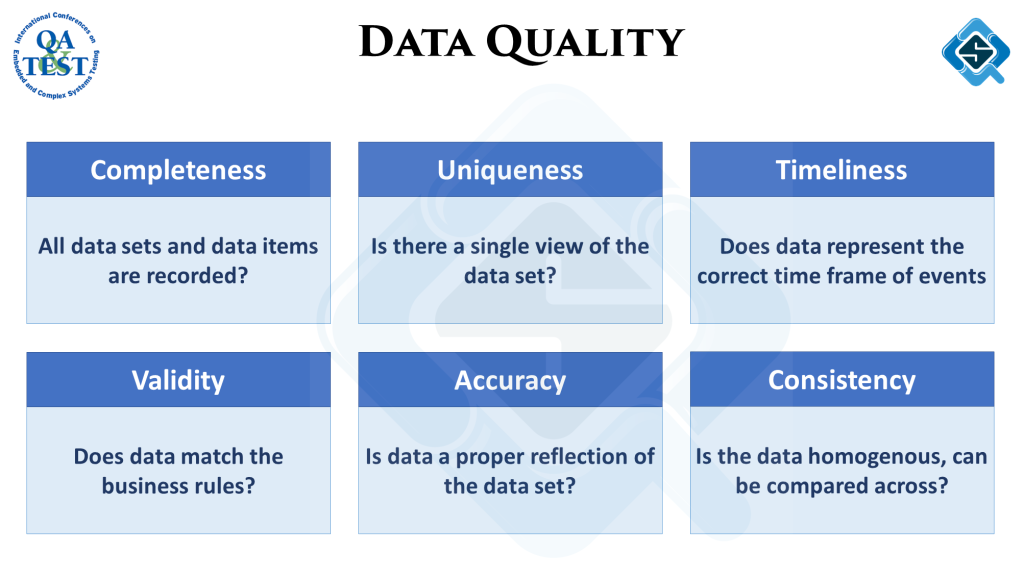
Stages across the data pipeline are curating data with different objectives, therefore the quality dimensions to look out for are also different. While this is a very detailed subject and I usually do a complete talk just on this, the illustrates below summarizes some examples:
The talks and questions during the panel discussion unearthed some interesting points which I feel might be very helpful for teams exploring to test AI systems.
For safety critical devices regulatory bodies provide practices, processes and guidelines governing how safety approvals will be given. With AI products the community is debating what is more practical and pragmatic approach to certify AI systems.
Due to evolving nature of AI products, it is possible the guidelines will be more process based rather than around the product’s functionality itself since those are going to be a moving target. It goes without saying this is a very complicated problem to solve and the stakes are high. Take an example of self-driving cars and it’s impact.
In certain ML models, like deep learning, are mostly ever evolving. After the product is released, it still keeps learning and changing it’s algorithm. This poses a different set of challenges and the traditional test and release cycles are not enough. Observability and production tests become a must in such situations, which means testing becomes an ongoing activity happening in production.
AI models build their intelligence through machine learning by consuming large amounts of training data. The kind of data we provide is going to govern the kind of assumptions the model makes. In recent years a few incidences have surfaced where the AI model was biased to a certain group of people or other variables.
The challenge, many times we don’t even know if a bias exists. For instance, a leading tech company had an AI program to short list resumes. Later it was discovered the program assumed highly skilled people are usually male candidates. This was perhaps due to the training data it had, since most candidates who got job offers were men, it made that assumption. Even after knowing the problems it was very hard to fix it, and eventually they had to stop using the said AI program!
The most evident solution is first to figure out any biases that may exist before the training data is provided. The challenge is off course knowing about those biases. What can also help is giving a very wide range of data. Also train & test on every different data sets. This can highlight any incorrect assumptions and biases that might have been built / inferred from the training data set.
While regulators and the wider community is looking for ways to have some baseline practices, however the use cases of AI are very widespread and validating the underline algorithm is challenging, it’s going to be hard to reach some generic product-based validations.
Having said that, there are some techniques which can help look at these solutions from a different paradigm, which can be used as good techniques to identify potential risks in such systems. One such technique is STPA which suggests an alternative top down approach of looking at holistic systems and focusing just on safety instead of focusing on the system’s functionality.
The field of AI is exciting and has lots of applications. By now we are already seeing many products started to use AI in some capacity. This is going to ever increase because of AI’s capability to process multi-dimension factors and process large amounts of data which can be hard for humans to do.
Apart from topics discussed above, the key challenge IMHO is going to be lack of skills. Looking after the quality aspect is going to be even more challenging, these systems needs engineers who have technical insights into how the underlying technology works plus have ‘testing Acumen’ to test well. While this has always been a problem, seems with AI systems & Big data projects this will be an even bigger one.
Among all the online conferences, Automation Guild is the best automation conference I happily attend, this year was a pleasure to speak at it again. If you are in automation, I think this is a must attend conference. In this post I’ll give a brief overview of my talk at the conference.
The subject of big data is exciting, but I’ve felt there is a general lack of testing maturity in the space. I guess since the industry itself is comparatively new and is evolving. The walk was to share some basics about big data and how testing & automation works in this field.
The evolution into big data has been fueled by technologies which have made processing lots of data at high speeds easy, and most importantly the ability to react to the insights very quickly. We discussed all these factors quickly, summarized in this image:

The objective of big data projects is to gather insights / analytics to understand and solve problems. For that to happen, data from few or many sources may be needed to run analytics on. Now acquiring the data is usually not a big problem, to get it into a structure where it all makes sense collectively – is the challenge.
That’s where the concept of a data pipeline comes in. The data is passed through different stages of ‘transformation’ / ETL (Extract, transform, load) to make it more usable for our problem at hand.
Like Web applications have some standard tests that happen, similarly in big data there are some tests which are common. However, they are nothing like the ones we do for web applications.
In data projects, all we are dealing with is ‘data’, data in and data out. The challenge is transforming the data as expected and building models which actually solve our problems. Therefore, most testing in this industry revolves around ‘Data Quality’.

Within the three stages of the data pipeline, there can be many ETL activities happening within. For each ETL, deciding what type of data quality checks are needed is important. In the talk we walked through a basic process of how to determine that.
Because of the kind of tests we have in the big data space, automation also works quite differently. It’s more about fetching sets of data and checking if the right logic / business rules was applied. To perform these activities, some data platforms provide the capability of doing that easily, if not the technologies used to build these ETL flows are also then used to test them.
Talking about languages, Python is used widely because of it’s data processing capability. These scripts are used within workflows to do the required validations. The most common validation is checking of all data has been copied from point A to B. Sometimes while moving data from one space to another, files or records get missed, maybe they get truncated or other reasons. This is just one of the 6 quality dimensions.
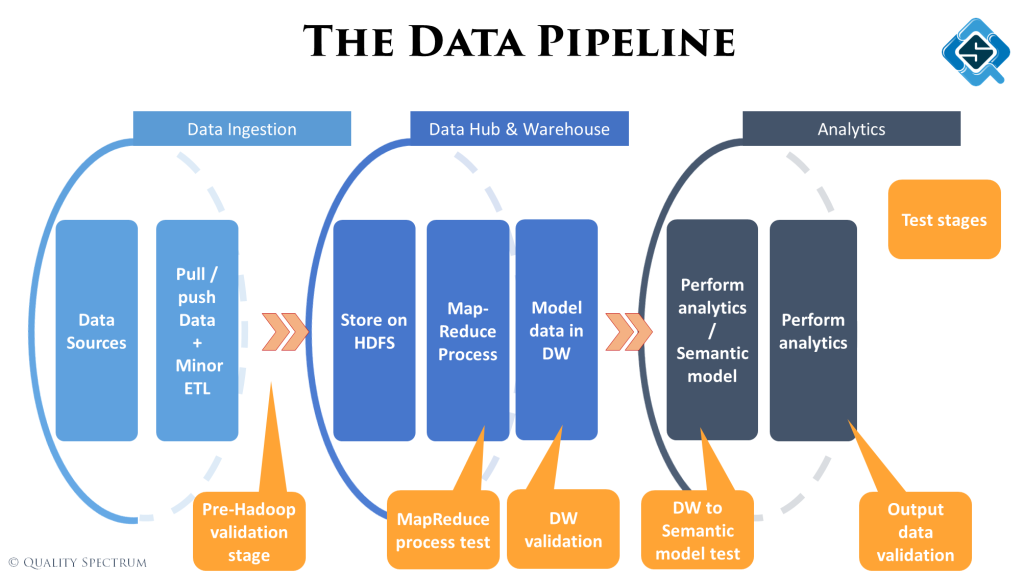
In the talk we walked through a sample pipeline and explained the kind of tests that can be done and how these tests would be executed. The image below summarizes all the checks discussed. The data pipeline was also expanded to show activities happening within the three stages and how they are teste

The subject of Big data fascinates people and businesses. While this might be just a buzz word, big data is immensely helpful to unearth important information and in the 21st century, information is power.
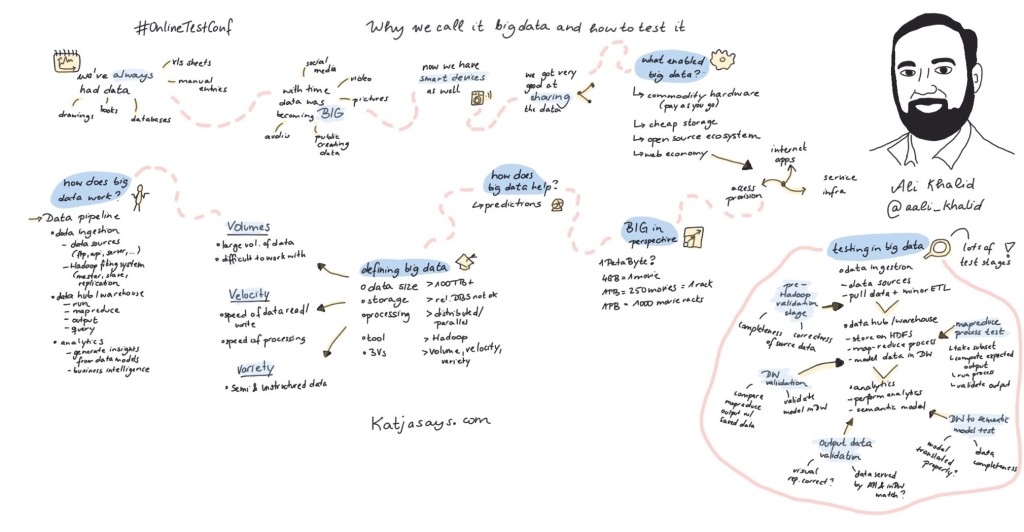
In this post, I’ll summarize my talk at the OnlineTestConf2019 titled “Why we call it big data and how to test it”. The talk was also recorded and can be watched on YouTube here.
I start with talking about little bit history of Big data and what factors fueled growth and innovation in this industry.
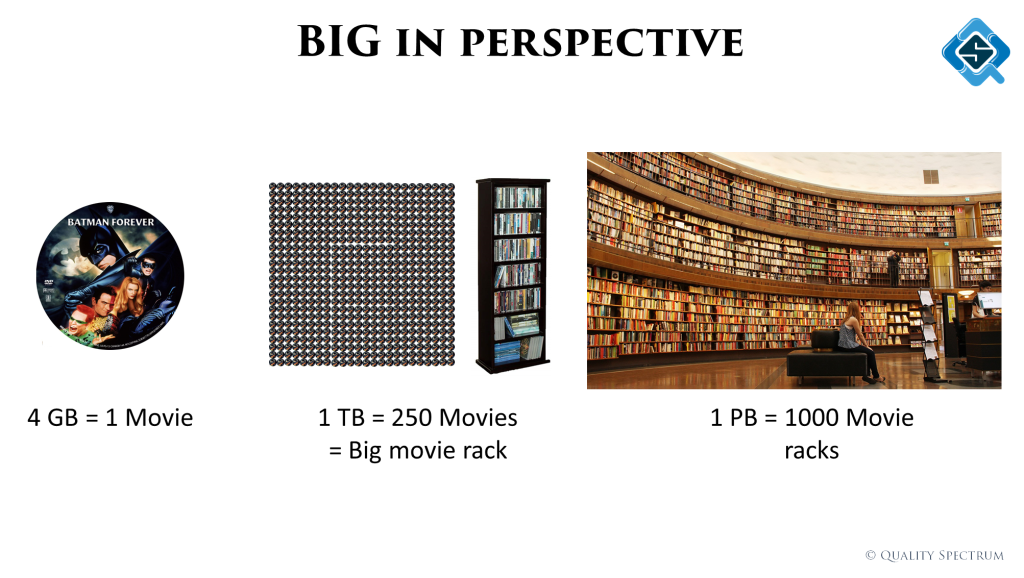
Next we put ‘Big’ into perspective to help in understand the sheer size of data and the challenge it poses to process it.
When would a project classify as big data? Is it only the size of data? This slide explains the different ways we tried to classify it and the most common method used.
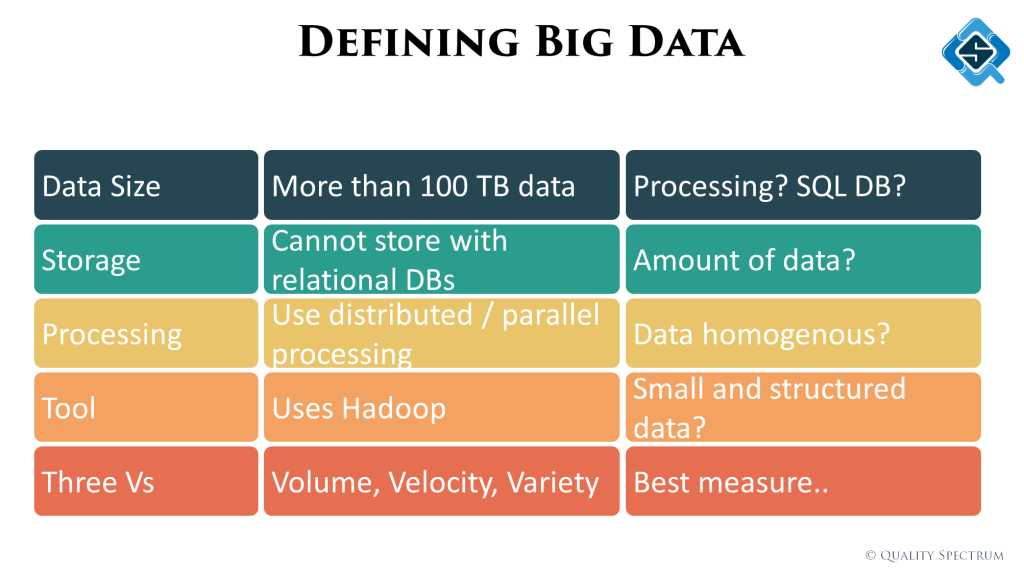
Hadoop is the most widely used big data platform which is also open source. I talk about it’s widely used MapReduce process and different products within like HDFS, HBase and HiveQL.
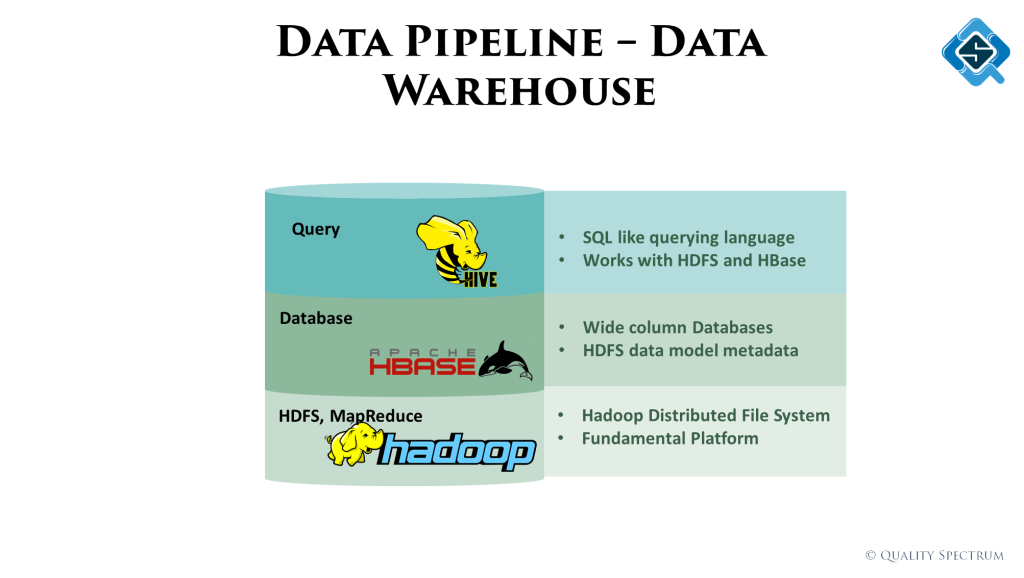
All we are doing in a big data project is collect data from different sources, hash it up into meaningful big tables and generate insights from it. There are three main phases you might have in a big data project.
At the end we quickly skim through the different type of tests we perform across the pipeline. At each stage, depending on the type of activities being performed, the type of tests will be different.
Katjya did a very good sketch summarizing the talk she mentioned in her tweet.