admin

Framework for scaling analytics – Data 2030 summit

Stages of Maturity

An organization goes through different stages in it’s maturity. Following are common stages an analytics function would go through as the business and the analytics team matures.

Change management principles

At each stage the key principles to look out for enhancing the change are different. Here is a summarized version of these principles.

Building capabilities across stages

The technical implementation for these four stages will differ in terms of what capabilities need to be built which will serve for the current state and graduate to the next level.


Going from DevOps to DataOps – Google I/O Extended

As the data analytics space evolves, delivering these solutions at speed with single touch deployment becomes more important and challenging. At a Google I/O Extended event gave a quick overview on what is the difference between DataOps and DevOps and some tips to implement DataOps.


While there is a lot that can be said on the subject, quoting only 3 tips discussed in the talk.

Modularized Architecture

Analytics solutions are inherently an exploratory exercise, it’s near impossible to detail at the outset what the solution should look like. Business domain experts look at the curated data set and explore what insights can be gained, and refine what metrics should be captured. All this is an exploratory exercise requiring the ability to build small iterations of the analytics solutions at speed.


To enable this, ensuring separation of concerns while designing solutions is essential to structure the architecture to allow individual components to be updated and deployed in stages rather than having to release the whole data pipeline in one big bang. This allows for quicker and more frequent releases, which leads to faster feedback and iterations.

Infrastructure as code

The industry is still grappling with finding a singular platform that does the data lake and data warehouse well. Needless to mention the large amount of integrations required to ingest data from a variety of platforms and tools.  All this leads to analytics solutions having to work across multiple platforms.


Provisioning, updating and maintaining these platforms can be a challenge. If these can all be managed services then it can elevate a lot of maintenance effort. If not, all infra management and deployment should be managed as Infrastructure as code. That means provisioning, deploying and maintaining platforms is pretty much automated.


This reduces platform errors caused by manual configuration mistakes and makes testing these platforms easier before deployment.  

Automated tests

Confidence to deploy quickly requires to build capability to test solutions very quickly. Varied levels of automated tests need to be built starting from job level tests, to pipeline stages and then across the data pipeline depending on the use case.

Snowflake Tips

Snowflake is a powerful tool, which makes creating data models very easy and convenient – with the speed of distributed computing on the cloud. A common mistake engineers do is using the tool as they ‘think’ it should work instead of how the tool was ‘intended to be used. 

Role based access control

Snowflake makes managing user access easy and slick – an individual if assigned multiple roles can switch between them fairly easily. Also resources created with one role cannot be accessed by another – unless it’s a higher role which through RBAC inheritance can access those resources. 


Pre-defined roles

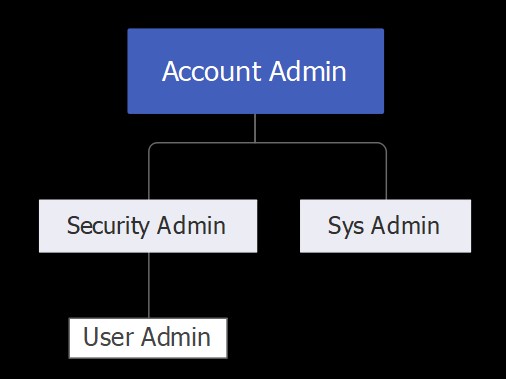
TIP – It helps to remember the five pre-defined RBAC roles and how they are related.


Using the right role

While creating data assets or components to be used within those assets, you will be able to access them only if working with that role – or a higher role with custodian oversight. 

TIP – Ensure while creating or using data assets you are working with the right role

Ingesting files

During initial exploration of your data asset, you most probably will have to ingest semi-structured data to do some data profiling or analysis. While the wizard for loading data in tables is quite easy, I prefer to use code wherever possible. 


Creating File Format 

				
					-- Create file format to ingest semi-structured data
-- Remember to execute using the right user  role!
CREATE FILE FORMAT dbNAme.schemaName.tableName
TYPE = 'JSON' 
COMPRESSION = 'AUTO' 
ENABLE_OCTAL = FALSE 
ALLOW_DUPLICATE = FALSE 
STRIP_OUTER_ARRAY = TRUE 
STRIP_NULL_VALUES = FALSE 
IGNORE_UTF8_ERRORS = FALSE;


Working with JSON files

It’s often a good practice to ingest raw data as it is, and then cleanse and curate in subsequent steps of your pipeline. But looking at raw data in one column can be tricky – a neat way to visualize it:

				
					SELECT 
column_name:"key_name"::<datatpe> AS col_name_to_display,
col_1:"key_1"::STRING AS first_column,
col_1:"key_2"::STRING AS second_column
FROM table_name;


To flatten semi-structured data is quite easy as well, helps in visualizing what the data may look like before going ahead and creating all those tables.

				
					SELECT 
value:key_1::VARCHAR AS First_Column,
value:key_2::VARCHAR AS Second_Column
FROM table_name,
LATERAL FLATTEN(input => column_name:root_key);


You might want to cast a value from some key/value pairs as well and display them nicely in the results:

				
					SELECT 
column_name:key_name:nested_key_name AS col_display,
column_name:key_name AS col_display,
value:nested_key_name::VARCHAR AS HASHTAG_TEXT --casting to varchar
FROM table_name,
LATERAL FLATTEN
(input => column_name:key_name:nested_key_name);


After all this is done – you’d want to create a view from this for users to be able to read raw data

				
					create or replace view database_name.schema_name.table_name as(
	SELECT 
	column_name:key_name:nested_key_name AS col_display,
	column_name:key_name AS col_display,
	value:nested_key_name::VARCHAR AS HASHTAG_TEXT --casting to varchar
	FROM table_name,
	LATERAL FLATTEN
	(input => column_name:key_name:nested_key_name);
);


Data pipeline’s architecture – Open source Vs Managed services

Deciding what tech stack to work with can be an overwhelming decision due to the ever changing business demands, vast considerations and choices of platforms, the skills you can hire easily for and most importantly – the Cost.


As soon as cost is mentioned, often people think the answer is using open source – because it’s free, which is not an entirely true statement. Open source does not always mean your not investing anything – in many cases you might be investing the most costly asset- time of the engineers to build what open source platforms lack out the box, and managing team’s capacity is one of the most important aspect of software development.


There are a couple of dimensions to look at this problem from which all indirectly affect cost. let’s look at this from different perspectives to get a holistic view.


Building services


To build data pipelines from ingesting data, cleansing, curating and modelling – end of the day all that really requires just plain SQL to manipulate data. However to get to a point for us to write those SQL (like) queries we need to build a lot of underlying services for:


    • Read data from storage locations (Databases, APIs, Kafka, FTP etc.) in different formats (SQL DBs, JSON, XML, CSV etc.) and save them in some distributed filing system (HDFS, ADLS etc.).


    • For curation set configs, read data from different formats / locations in dataframes, perform cleansing and curating then saving back.


    • Write lots of util functions for activities which are commonly repeated and UDFs (User defined functions), which are quite a few for data pipelines.


    • Maintain these util libraries to support changes in underlying platform / libraries (e.g. Spark, configs, logging etc).


    • Build added services on common utlis for other common activities like pushing data to other platforms, querying data from various locations across the data pipeline or serving through APIs for real-time use cases.


All of these activities take considerable time and effort to develop and mature, which can mostly be done more effectively using managed services, who have teams specializing in just building libraries and services on top of open source technologies.


Keeping up with releases


After building these services it does not end there. The underlying technologies are in constant flux, often the decided tech stack also keeps on changing as the demand changes and the industry evolves. That means maintaining these services is often a big piece of work too.


Furthermore, flakiness in the operation of these services has a direct impact on the analytics solutions being designed. Teams who choose to build these services on open source foundations often find a good portion production issues attributed to these services not working as intended.


Reusing common services


The activity of building these services on top of vanilla open source libraries is often not given it’s due importance. Engineers often don’t consider this as a significant piece of work – and easily end up writing their own logic for something which has been solved already.


A theme I have seen across multiple organizations is how much rework teams end up doing. Instead of reusing what some other team has done, they all end up writing their own ‘reusable service’ which is being reused only by them! This is a massive overhead and lots of unnecessary rework teams end up doing.


Ultimately it’s SQL


To get the insights and analytics we need – the core activity is writing SQL logic across the pipeline, which considering all the points mentioned above usually turns out to be a very small portion of the total effort. Most of the team’s energy is spent in managing and maintaining these services – and the most value to the business is coming from that small portion of time we invest in writing those SQLs.


Departmental Objectives


As discussed, building these services is a time consuming activity. Another dimension to look through is – what are your departmental objectives? As an analytics team are you tasked with generating insights for the organization? Or are you meant for creating a platform for business users to generate insights themselves.. And yes there is a big difference.


Generating insights


This is where most teams start from – business users want to get insights into their operations and start seeking help to generate those from a newly formed analytics team. As they see value, the number of use cases grow and so does the team. Depending on the adoption of data driven decision making practices, organizations can stay in the mode of still heavily dependent on analytics team to generate the BI reports for them.


In some cases analytics teams wise up a little and give access to creating some custom reports for business users also – freeing up engineers time from just translating a small request into a basic SQL query to join a few tables / columns in a view.


If this is where your team is today, then perhaps your primary job is to build data models and insights for your team. The part of building common services ‘to support’ this work is a distraction and not necessarily you want to spend more time perfecting yourself.


Truly self service


As organizations mature and business users catch up on being tech savy enough to query data from a data warehouse and build reports for themselves – you’ve started to move to self-service. By then it’s highly likely you are bringing considerable amount of data from various parts of the organization, meaning your compute resources are shooting up and using managed services may be offsetting the benefit.


At this stage – it may make sense for the core data engineering team to start building those common services and make that their primary job – since by now all they are concerned with is pumping new data sources into the data warehouse on a solid foundation, while rest of the organization has enough skilled people to generate reports and basic insights from data sitting in the data warehouse or analytics teams running ML models from the data lake.


Tech stack considerations


Another common reason for choosing open source and building services on top by the department is to have flexibility & portability – which is hoped to make the platform future proof. At first it does make sense, however there are some nuances to this.


Vendor lock


Technology, platforms and maturity of design practices are all changing at an incredible pace. Within few years the whole picture can change and the tech stack which was once considered top of the line quickly becomes legacy and sluggish.


In this climate of change, relying heavily on any one cloud vendor does not sit well with organizations – and rightly so. Portability is on everyone’s mind – and many mature organizations get stuck having to work with one vendor, and may end up paying significantly high costs just to continue business as usual.


With open source, organizations hope they will maintain portability to allow switching platforms / cloud providers if the need arises. While it is true, e.g. if bulk of your pipeline is built with Spark – all platforms will support spark and make the move possible. However with data pipelines there are a lot more considerations then just support for e.g. Spark.


Across a typical data pipeline, there are a LOT of platforms you’d need integrations with. Plus a lot of peripheral services like scheduling, logging & monitoring, security / RBAC. Even if your main ETL pipelines are open source – there is a lot more going around which is not as portable and will have tight dependencies on the platform you are using. Many times I’ve seen teams struggle just to migrate from one version to the next – point being migration anywhere is going to be an overhead and painful process. Sure can get little easier if you use the right design principles, but still will pose a considerable challenge.


Future proof?


The question remains – is there a way to future proof our tech stack? The honest truth is its a balancing act, because no matter what tech stack you opt today – there is a very high chance it will need major upgrades few years down the line.


This is a sticky topic – but IMHO it is very hard to have a future proof tech stack. The aim should be to choose a tech stack which is scalable and has the capability to deliver features for the coming coming few years with very less maintenance.


Summary


Here are the summarized points to consider:


  • Building services on top of open source platforms / libraries can take considerable effort to build and mature

  • Maintaining these services is also an on-going activity

  • Teams sometimes struggle to reuse services and end up building their own logic for the same function again – especially true for larger or distributed teams

  • If the analytics department is primarily tasked with building insights, then trying to build these services will take way more time – taking you away rom the primary objective

  • Open source does not mean switching platforms / cloud providers is going to be easy – data pipelines require a lot of integrations and peripheral services which are not always easy to migrate

Given the points above – it may make more sense for analytics teams which are early in their journey or are in the growth trajectory to use managed services instead of going open source. The cost of using managed service might not be as high due to the volumes – and the focus at that point should be adoption of data driven decision making instead of cost optimization.


Once an organization has reached a level of maturity and the analytics team is now primarily moving towards supporting self-service, by then the volumes can outrun the benefit of using managed services – making it more cost effective to build services on open source platforms.

Storage & compute separation for DataOps

To deliver data analytics solutions at speed with quality requires the right infrastructure and platform, giving the agility to orchestrate infra to develop / test / deploy and scale in real time as per demand. An important component to do this is separating storage and compute. Without this, the infrastructure is very heavy & clunky to use – hindering orchestration of environments on demand.


What does separating storage & compute mean


Let’s try to understand this with a crude example. A laptop has both processing power and storage (your hard drive) on the same physical board. If we place important data on a remote storage system connected through a network (let’s say a portable drive ) – that would mean your compute and storage are now separate.


In the world of databases – we can have the data sitting in a separate persistent layer / storage like Azure’s ADLS or Amazon’s S3. We can read/write data to / from the data store easily and at speed. For any processing on the data – we would have to use separate ‘compute’ resources which can be from the same cloud provider, a different vendor or an on-prem setup – depending on your architecture.


This would give you flexibility to scale your compute resources and storage resources independently of one another. Without this, it can be costly and dime consuming to scale your analytics projects, and to develop / test them.


OLTP vs OLAP


It helps to understand traditionally why we had tightly coupled storage and compute infrastructure and was not seen as a challenge before. For this, let’s examine how the requirements on databases are changing.


OLTP


Typical software applications / OLTP (Online Transactional Processing) systems have unique requirements in terms of speed of processing along with size and type of data they process. Typically they have to process transactions within milliseconds performing CRUD operations for a smaller records at a time. Depending on the system, these numbers vary significantly – for example airline booking systems in some cases can process around 60,000 operations per second! – whereas a shopping cart website search query result can go up to a few seconds.


To achieve this speed – the processing and storage needed to be very close and easy to access. The speed on network and bandwidth has not always been this great as it is today, hence most traditional systems were designed to be on the same infrastructure – in other words – compute and storage were tightly coupled.


OLAP


For data warehouses / data analytics applications / OLAP (Online Analytical Processing) the requirements are very different. These systems don’t necessarily care much about the speed of writing data – since many times this will be batch processing or near-real time. However they do require high compute power to process the data / transform it / model it and present it.


Often new analytics projects start with just testing the waters. It’s not uncommon for few iterations on smaller data sets to find what information / measures / metrics will be more helpful. As the project evolves, the demand on data size & processing speed may increase exponentially which can quickly pose a problem with traditional servers. Meaning – scaling infrastructure for analytics is significantly harder.


How compute & storage separation helps


Scaling compute


Imagine having a server (on premise or in the cloud) procured for a project with x compute & storage capacity. When demand increases – it’s not going to be straight forward to add additional nodes (compute). On-premise will be significantly harder since you may have to procure new hardware. Even on cloud you’ll have to go through some steps to get that extra resources – which will have an associated additional cost regardless of if you use the resources or not.


If compute was separate – all that would need is to spin up more compute clusters as we need them and pay accordingly. Scaling becomes infinitely easy. Storage on the cloud is not a problem – it’s quite cheap and easy to get.


Sharing & usage of data


Data sitting in a data lake can have a lot of different users – who might be using it for varied processes. Some might be using if for real-time processing – like feeding data to an operational system, or near-real time processes being used for updating internal records for operational systems or processes preparing data models to be used for BI reporting / analytics purposes.


If access to this dataset is not readily available and the data lake cannot support the additional load on thee I/O’s and network, we might end up making copies of that data for different use cases which opens a whole new set of challenges and upkeep.


Having all that data on a cloud storage like an S3 bucket or ADLS makes access extremely easy. We would just need to change the configurations – rest of the hard work of routing and networking is handled by the cloud provider. If all your data resides on the cloud – access to that data for all services is infinitely easy & quick now.


Spinning up environments


For building DataOps practices – it’s vital we have an infrastructure that supports orchestration of environments on demand and scale down when not needed. Imagine having a data pipeline with 100s of tests running across different stages. Each stage of tests may require to spin up resources for compute and storage – and after execution free them up.


With tightly coupled systems – creating a new environment is a pain. It often means heavy infrastructure or licensing cost upfront. This can significantly hamper the development / improvement of your pipeline because of the limitations on environments and execution resources the teams would have.


Such environments tend to be one big shared resource pool – used by multiple teams and processes. These dynamics easily create problems of compute or even storage resources peaking and causing problems for teams / processes. You’ll often find teams trying to schedule jobs around one another and setting up limitations on when to run jobs to ensure they don’t interfere.


Finally – you may often need different environments with different security controls if you are working with personal data. For example that could mean you may need 2 staging environments – one with tokenized personal data and the other un-tokenized. With compute and storage separate -real easy to do. If tightly coupled – this would require a huge upfront cost.


Mobility


With on-prem servers, it can become a challenge to move your datacenter. Managing datacenters and maintaining them is a tricky and costly business. In some cases companies can’t move offices just because they cannot move their data center! Moving your data to the cloud saves you all that hassle and also in many cases is way more cost effective.


Pay as you go


Storage cost is extremely cheap today – especially through cloud providers. With on-prem servers / local storage the cost can be 5x higher and still will not be as effective (low latency / high bandwidth) compared to the cloud providers.


Migrating to separate compute


Activities needed to make the shift would primarily depend on what cloud provider you choose and what tech stack you are migrating to. Finalizing a cloud provider can be a time consuming project, but clearing your tech debt to support / scale up to the new desired platform will be an ever bigger task. Often teams would need to migrate their jobs / workflows to newer versions or different platforms to be ready for the migration.


End of the day – as a data analytics team our main business is not be to build /manage datacenters, instead we worry only about how to process raw data and serve it reliably. Cloud providers main job is to run datacenters and develop services to use them. So let’s leave what they do best to them and focus on what we should primarily focus on – deliver analytics to support Data Driven Decision Making !

Delivering Data Solutions at Speed with DataOps

Typical data architecture


A typical data architecture diagram shows ingesting raw data passing through levels of curation & transformation, building a data model and finally generating analytics. This structure is pretty standard in most diagrams and seems to be a very straight forward way of designing an analytics solution. The stages tools and platforms might vary depending on various factors but the basic building blocks usually stays the same.


The requirements we consider


These solutions are driven by common requests data engineers get – which are focused around business rules to cover, data load requirements, latency & performance. What we often miss out factoring is ‘rapid change’. Software solutions are expected to change which understood, however the kind of change analytics solutions have to go through is a bit different in nature.


Rapid change is inevitable


Analytics solutions combine data from various sources and generate insights. As we add more sources, explore more data, learn more from the data we have and look for more insights our data models & analytics change. This is a perfectly normal cycle through which any data solution is expected to go through. The tricky part is: these changes are to be expected to be A LOT and VERY frequent. Therefore the need for ‘rapid change’ becomes more important and challenging.


Painful to update


The common architecture flow we talked about, while seems nice & tidy – it also tightly couples different stages together which makes updates time consuming and deployment harder. Even if a change might be as simple much as adding a new SQL statement, with this structure the change process would need a proper solution design, implementation complexities, rigorous tests and deployment pains.


Putting teams at odds


Over time these ‘inefficiencies’ in deploying changes & solutions starts to put engineers at odds with the stakeholders and leads to further complications. If you’ve been working on data analytics projects for some time, this story is not new to you at all.


DataOps to the rescue


I still sometimes get confused on the definition of DataOps, and there are quite a few out there. The way I understand DataOps is as follows:


  • Following Agile practices to push results iteratively

  • Incorporate DevOps culture & practices of CI/CD pipelines and creating environments on the fly

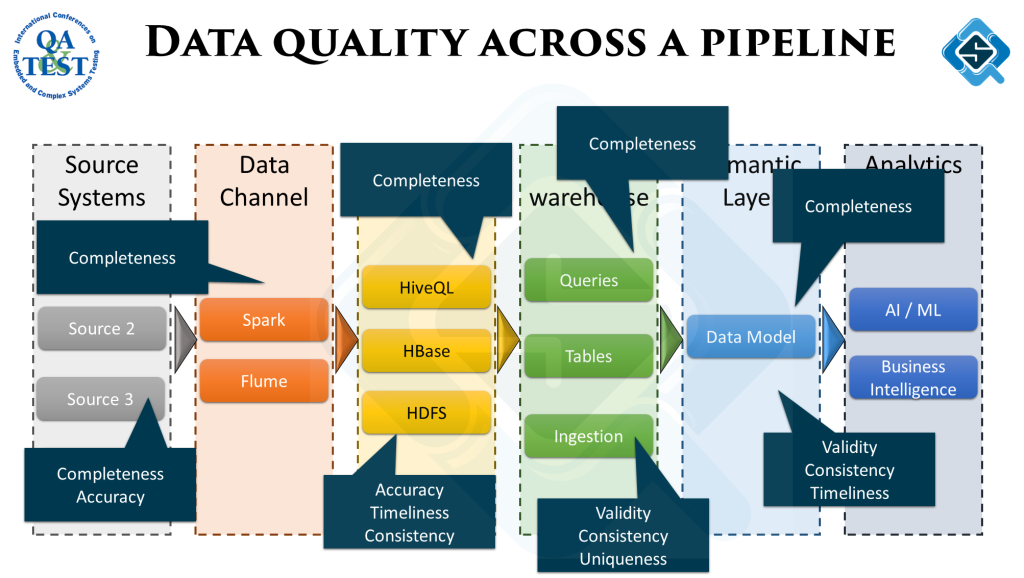
  • Measuring data quality across the pipeline

  • Modularized / SOA architecture

Solving painful updates


Before going more into DataOps, I want to discuss the problem we want to solve – painful updates. While all the 4 aspects mentioned above contribute to make updates less painful, SOA architecture and data quality checks have a larger contribution.


SOA – microservices & pipelines


A while ago when building big monolith backend systems was the norm, SOA architecture came in and we started to see microservices popping up everywhere. Now we know changing a microservice is far more easier than making changes to a monolith. The same goes with data pipelines.


Traditionally data engineers have big blocks of workflows – ingestion & data lake, data engineering & data models, analytics / visualizations. Within these three blocks is a giant web of workflows which are very dependent on one another. If one fails, you see cascading failures and it’s takes some digging to figure out what failed where. Also connectivity between these blocks is sometimes blurred, there aren’t very clear ‘contracts’ of what is to be expected as an output from each stage making them all very tightly coupled.


Modularize your pipelines


All components (individual ETLs) across these blocks should be self-contained with clear contracts of what they receive and what they serve as a result. Same goes across different stages in the overall pipeline. Self-contained & reusable workflow components make it easier to develop code isolated changes to individual components and deploy them. Also it allows for trying out / swap around different tools / platforms across the pipeline since all each component should care about is servicing the contract.


DataOps


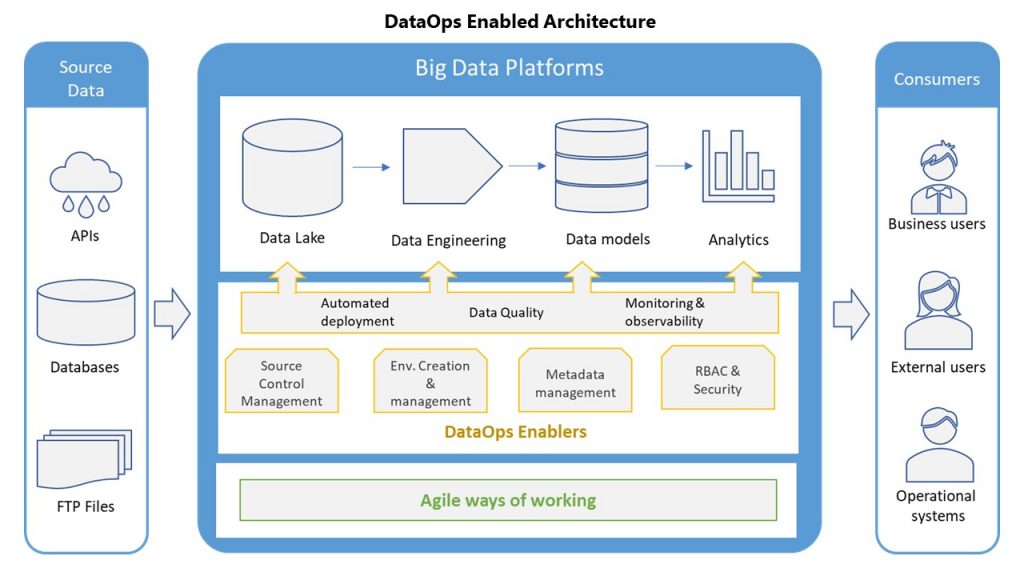
Coming back to DataOps, here are a few prominent components of a DataOps architecture.


DevOps


Branching/Merging


Having a code branching / merging strategy used for all product code and infrastructure as code is crucial. While every team is using some kind of source control management tool, sometimes the lacking is in the branching / merging strategy. Keep repos modularized and avoid having long lived feature branches.


Environment orchestration & management


Ability to spin up and tear down compute & storage resources as required. For ease of maintainability & reusability, have infrastructure as code. If possible using SaaS services can make this even easier, with a tradeoff of additional cost


Automated deployment


Using Continuous Integration tools ability to deploy code & workflows across different environments (dev, staging, production). CI tools usually also configure different quality gates across CI pipelines to validate the code quality & perform regression tests.


Automated tests


Have automated tests to regress the data pipeline’s functionality validating any new updates are not breaking old functionality and everything is working the way it is intended.


Data Governance


Metadata management


Manage different types of metadata to allow for having all users a common understanding of the data assets and ease of updating.


  • Business metadata – business owners & business rules

  • Technical metadata – database structures & allowed values

  • Operational metadata – Data lineage & data currency

Security and Access controls


Have access controls on all the data assets to secure the data & be compliant with regulatory requirements. Role based access controls (RBAC) are one kind of control mechanism, you’d want to have encryption and other security measures to ensure the safety of your data as well.


Data quality in production


Simply put – have real time insight into the health of your data in production across the data pipelines. In case of any data anomalies have automated self-healing steps for simpler problems (e.g. workflow did not execute completely) or alerts for complicated issues (data from two source mismatching).


Agile ways of working


Team predictability


We talked about rapid change, team predictability gives a trend of how ‘predictable’ are the deliverables from a team. Measuring this can be a little tricky, but if your work tracking tool (e.g. JIRA) is configured correctly, it’s certainly doable.


Team velocity


How much work a team can churn out. As the practices discussed above mature, over time the team’s velocity should increase. This is accomplished by – getting smarter in prioritizing work that really matters and ability to release more features in less time.


Conclusion


The ability to make rapid changes to your data pipeline, and democratize the ability to change as much as possible is no longer  optional or good to have – It’s a must. The speed at which markets change, new sources come in, new problems statements come in to get solved keep on increasing. Therefore the need to quickly churn out new solutions & update existing ones is all too common and can be cited as one of the biggest challenges data programs face today.


While the word DataOps might seem fancy, the concepts being discussed under it are mostly not novel ideas and have been part of the evolution of design practices. In my humle opinion DataOps just helps with the confusion of how to apply these principles in data analytics projects.


If after reading all this your wondering – that’s a lot of work and not sure if this will pay off, teams without these practices end up spending way more effort anyway and the output is still slow and low quality. Might as well take a chance and make a few changes & see how it goes!


Intro to Data Analytics & Quality Workshop

The WHY


Getting familiar with the basics of data analytics can be a daunting task. With so many buzz words flying around and different technologies involved often folks get confused and takes time get the basics right.


This workshop was designed to demystify starting with data analytics & data quality for:


    • Engineers willing to begin with data analytics


    • Business owners / Managers working with data analytics & want to understand how things work under the hood


The WHAT


Before we talk about data quality, it was important to give an into to big data, data pipelines and all the stages across the pipeline.


Across the 2 hour sessions on two days, we first discussed the:


    • Fundamentals of data


    • What are data pipelines


    • Common activities at each stage of the pipeline


    • Introduction to data quality


    • Sample data quality activities at each stage in the pipeline


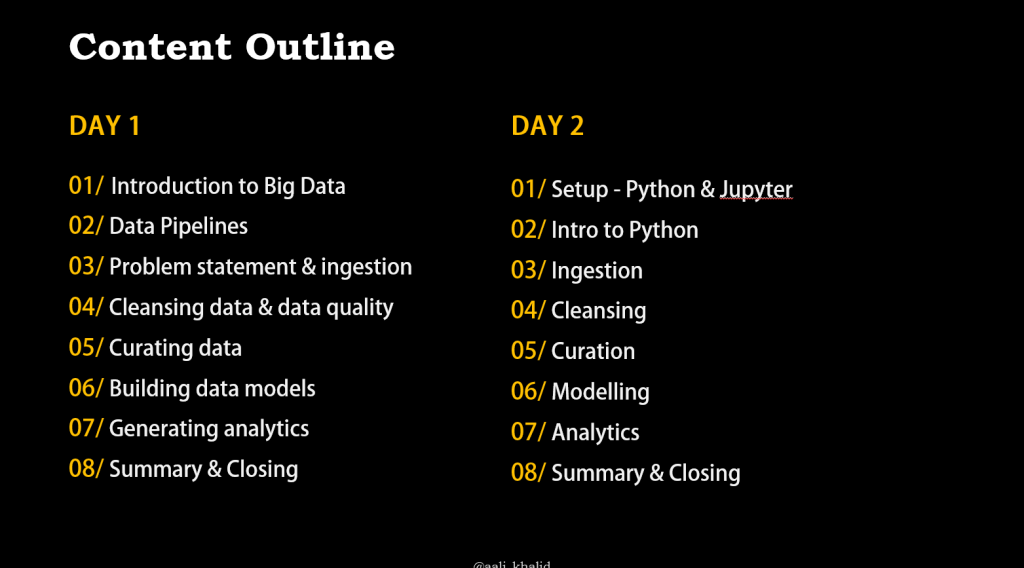
The first day was mostly to get the basics & internalize the activities at each stage without going more technical into the code


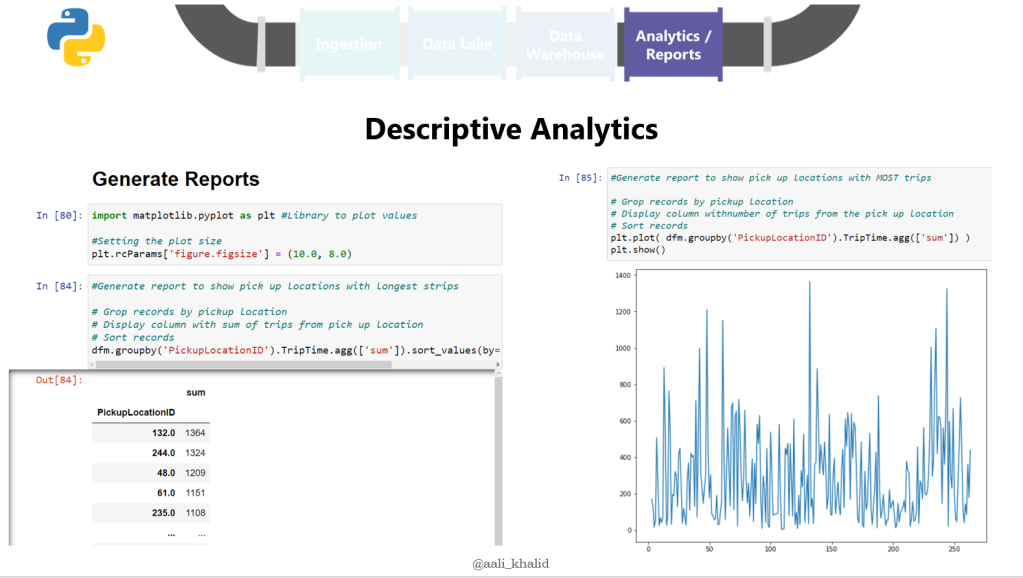
Once folks had an idea of what needs to happen at each stage, on the second day participants went about practically implementing all stages in the pipeline.


The HOW


This was tricky when I was planning the workshop. With most workshops, after some basic theory participants jump onto coding. I’ve always found that to be a rough transition which makes it hard for participants to follow along with, especially if they are working not writing code on a daily basis.


Day 1


Therefore, the first day was to understand the concepts, the secret was not just death by PowerPoint – but participants actually performing the steps across the pipeline / but not with code. To make life easy, we did that with excel – no tooling knowledge required – pure focus on understanding the WHY of each activity!


Day 2


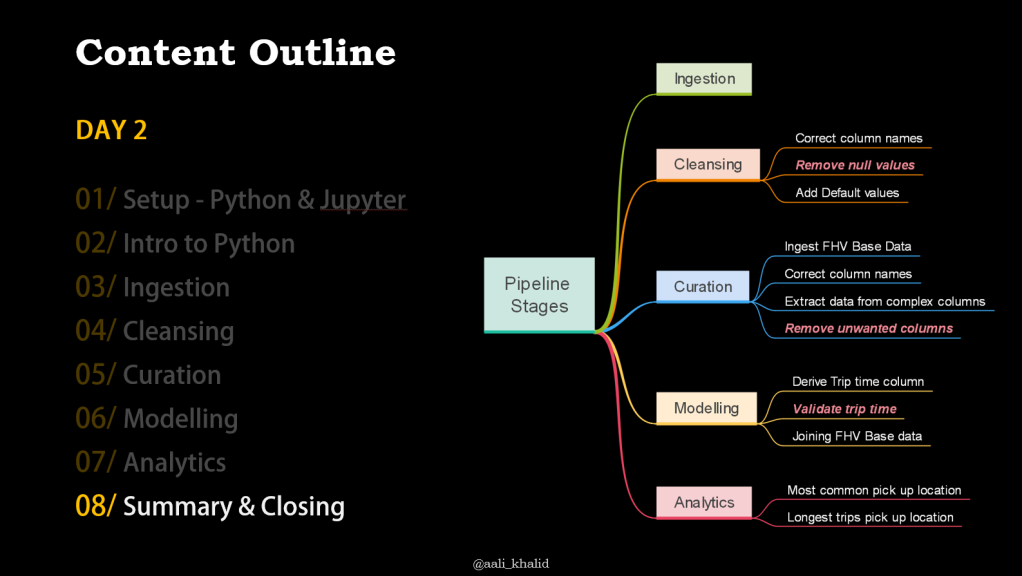
The second day was all about coding with baby steps. We started from:


    • Learning the basics of working with notebooks,


    • Intro to coding in python and then


    • Ingested different types of data sources


    • Curation activities like flattening data structures


    • Creating derived columns & combining data sets to build a basic data model


The code was quite a bit to go over, but was designed in such a way that participants can easily follow along afterwards by providing ample documentation within the code.

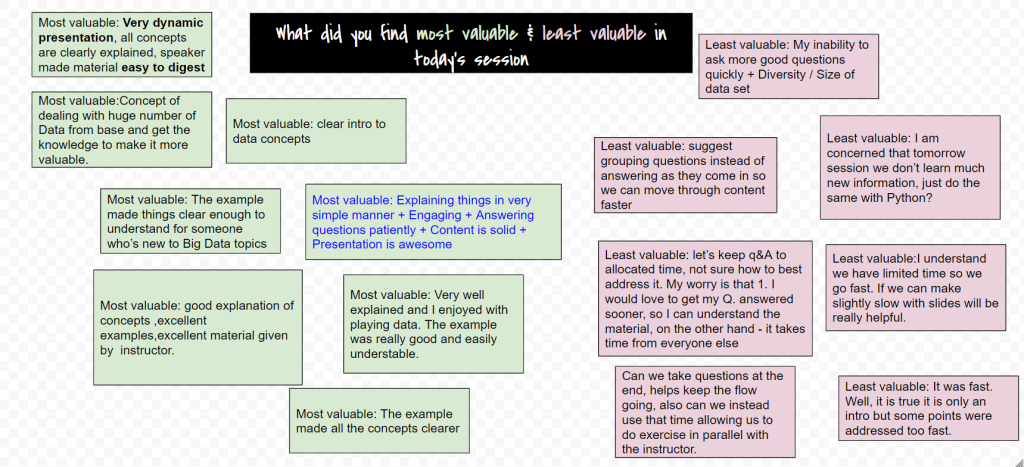
The Feedback


The content we covered was A LOT, I think could have easily been done in 6 hours instead of 4. It was a toss between dropping content and trying to cover more in less time.


That’s where my personality kicks in – I have a hard time cutting down on content – because I feel I need to share what I know, I’ve experienced the struggle of learning this – and hope people who learn from me don’t have to struggle as much.


“Explaining things in a very simple manner, Engaging answering questions patiently – Content is Solid and awesome presentation”


Participant feedback

Data Quality in Real time

When I started working in Data & analytics projects, I realized testing a workflow during development is only ‘part’ of the story. We can ‘assume’ what kind of data we will get in production, but cannot be certain, therefore testing data quality in real time is going to be paramount.


On reading, exploring & supporting to fix data quality issues, the importance of these checks became evident. Over the years I’ve seen exponential impact of these checks and now are always a integral part of any data strategy I work on. The impact these checks have had are tremendous, I’ll highlight a few of the important ones here.


Builds trust in analytics


This is usually the toughest part of any data program – to build trust with decision makers in the analytics results being presented. A common obstacle to building that trust is skewed information coming out of the analytics – caused by data quality issues across he data pipeline.


When the analytics team is questioned about it – naturally it takes them time to figure out what could be the problem. With complex data pipelines the challenge is compounded and often can take a while to figure out the source of the problem. This slowness creates further distrust and takes away team’s capacity from delivering new features and instead spent on debugging old ones.


Once teams start to run data quality checks across different stages in the data pipeline, they are capable to identify data quality issues almost as soon as they occur. Teams are then able to preemptively highlight a potential data quality issue and very well equipped to fix the problem as well, since source of the problem is very easy to find now.


This changes the conversation from “why the data isn’t making sense” to proactive alerting of a potential upcoming data quality issue which might cause skewed metrics – and sometimes fixing the problem even before consumers get a chance to look at the alerts or skewed results.


Reduced rework


Analytics teams spending time on debugging data quality issues is a common activity you’d find on their sprint boards (unfortunately). True, there will always be ‘some’ capacity going towards this – simply because usually teams have very less control on the data ingested into the data lake. However this can get very bad if appropriate enablers are not in place, I’ve seen the amount of rework going as high as 50% of team’s capacity across a PI (quarter)!


With data quality checks running in production across the pipeline – this manual toil significantly reduces and teams mostly don’t have to spend time ‘finding’ the cause of the problem, instead have a very good idea of the problem source.


Mental peace


Not to mention the mental peace teams get from this. The thought of you never know what kind of nasty data might make it’s way into your analytics is pretty draining. Once teams see the this benefit – they often become the biggest drivers of implementing these checks.


Patterns of issues


Ever felt Deja vu while fixing an issue? Yeah that’s all too common. Over a longer period of time the similar kind of issues might keep coming up again and again. Since the occurrences are spread across time – not easy to make the connection.


With running data quality checks in real time – teams build a very valuable data set showing data quality across the pipeline over a longer period of time. Capturing trends and correlating them with possible causes becomes easier.


How to build Data quality checks?


There are a couple of ways I’ve seen this built – in a separate post will talk about how some best practices in building these checks.

Baking quality into your data pipeline

Organizations when start on their data analytics journey, it mostly begins as an MVP (Minimum Viable Product) and evolved over time. While that is exactly how things should go – sometimes they miss out on building the foundations right as they evolve their MVP. A big factor that get’s missed is around data quality, data governance & stewardship.


From my experience building a data pipeline it not the challenging part – ensuring data saved in our warehouse is of quality (fit for purpose) is the tricky part. Unfortunately this is easier said than done and requires some foundational work and structure to consistently deliver quality data.


About the talk


In this talk at TestBash New Zealand 2020 I gave a quick introduction to how data analytics works and discussed some basics of building quality into your data pipeline.


https://twitter.com/manoj9788/status/1330052146839031816?s=20&t=1tsAnJjd0vYObUMHmeyknw
https://twitter.com/heather_reiduff/status/1330051793909407744?s=20&t=0GH-GbSMtKsJHtLIjJopZQ

It all starts with data


It’s surprising how easy it is for teams to forget the importance of having ‘fit for purpose’ data – be that for business intelligence, analytics and especially AI / ML initiatives. This is precisely what I like to remind teams I work with is – it all starts with having the right data.


The Pipeline


For building enterprise data assets, often we get data from a lot of different sources across the organization & perhaps from 3rd part sources also. These sources have their own paradigms in which the data is developed and consumed, and may not always be consistent with one another.


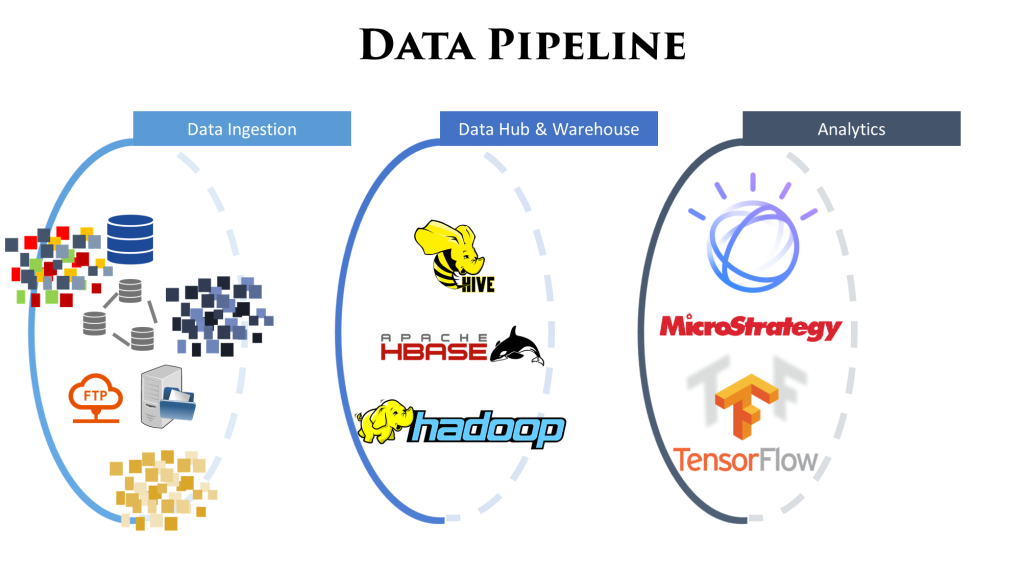
To homogenize all this data and make it fit for purpose, it passes through a lot of different stages of cleansing, curating, transforming and modelling. All these activities combined are called the data pipeline.


Image below gives a high level overview of a sample data pipeline:


Data Quality


To get the desired output from analytics, the quality of data across the data pipeline has to be measured and fixed. It happens at the analytics stage we get data which might not add up. Backtracking from there to figure out exactly what went wrong is a tedious job.


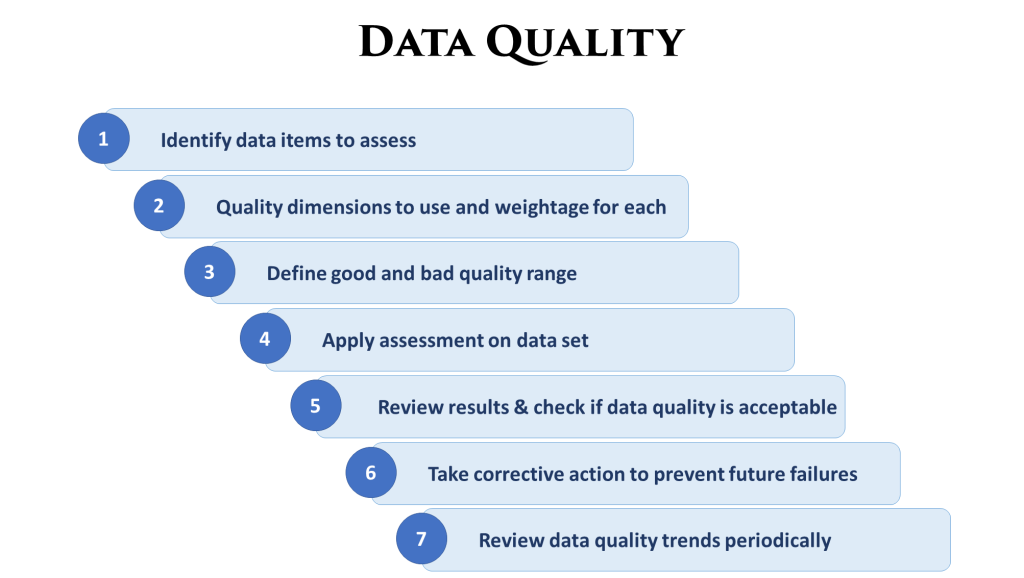
To avoid this, data quality must be measured across all stages. Here is a sample process to writing these quality checks:


At different stages, different type of data quality checks might be more important. While ingesting data we would be more concerned if the source data is as per the defined schema. As we move along the pipeline the objectives of the checks change according to the underlying ETL process.

Getting quality of the data right is always a journey and never ends. Being agile about this and consistently working on feedback gathered from these quality checks is paramount for success in any data analytics initiative.

Data Warehouse vs OLTP

OLTPs / Traditional database designs are perhaps one of the most common database types used. Data warehouse as a concept was introduced in 1980, but widespread adoption came a good few years later.


Since OLTP designs are very common and well known, It helps to understand the difference in purpose between traditional OLTP DBs and data warehouses.


OLTP USAGE​


Traditional DBs are primarily a persistence layer of an application – where data is changed very frequently requiring a quick operational response time. It’s all about the speed at which CRUD operations can be performed, and ensuring high availability of data for other processes.


To make that happen, these DBs are supposed to be:


  • Very quick in inserting / updating new records, those being the most frequent operations.

  • The DB can be accessed by different operations and therefore locking needs to be minimized.

  • Typical read operations usually fetch a small amount of data – so querying typically should be optimized and not heavy on processing

  • It’s crucial the data is consistent, entries match and are linked properly, which leads to:

  • Normalization – which helps with reducing redundancy, maintaining consistency making updates easier.

DATA WAREHOUSE​


Data warehouses have a completely different purpose. OLTPs are used to maintain data for ‘system of records’, Data warehouses are meant to serve as a single source of enterprise wide data for reporting. That means – OLTPs have small, quick and very frequent updates. Data warehouses (DW) are used for querying very large data sets and typically ‘batch’ updates which don’t have to be that performance critical.


To elaborate further this is how data warehouses are different in contrast with OLTPs:


  • The most important purpose of a DW is retrieval of large data sets through queries instead of very limited data sets

  • Since the primary job is retrieval of data – performance of ‘read’ operations is essential

  • Typically you might not have many operations trying to access the DW, therefore locking is not an issue

  • DW are a copy of OLTP data – that means we typically will not have frequent inserts or updates like an OLTP system since those are the customer facing ones

  • Since insert / update will not be as frequent, therefore performance on write operations is not a concern